DOE (Design Of Experiment), Response Surface Method (RSM), Optimization by ANSYS Workbench
۲,۴۳۰,۰۰۰ تومان تخفیف دانشجویی
In this project, a combustion chamber performance is optimized using DOE and RSM.
This product includes a geometry file, a Mesh file, and a comprehensive Training Movie.
There are some free products to check our service quality.
To order your ANSYS Fluent project (CFD simulation and training), contact our experts via [email protected], online support, or WhatsApp.
بر روی افزودن به سبد خرید کلید کرده و فایل های هندسه، مش و فیلم آموزشی جامع را دریافت کنید.
برای سفارش پروژه خود و یا بهره مندی از مشاوره رایگان، با کارشناسان ما از طریق ایمیل ([email protected])، پشتیبانی آنلاین و یا واتس اپ (09126238673) در ارتباط باشید.
برای کنترل کیفیت خدمات ما میتوانید از محصولات رایگان استفاده کنید.
توضیحات
What is the Design of the Experiment (DOE)?
Design of Experiments (DOE) is also referred to as Designed Experiments or Experimental Design – is defined as the systematic procedure carried out under controlled conditions to discover an unknown effect, to test or establish a hypothesis, or to illustrate a known effect. It involves determining the relationship between input factors affecting a process and the output of that process. It helps to manage process inputs to optimize the output.
Sir Ronald A. Fisher first introduced the method in the 1920s and 1930s. Design of Experiment is a powerful data collection and analysis tool used in various experimental situations. It allows manipulating multiple input factors and determining their effect on the desired output (response). By changing multiple inputs simultaneously, DOE helps to identify significant interactions that may be missed when experimenting with only one factor at a time. We can investigate all possible combinations (full factorial) or only a portion of the possible combinations (fractional factorial).
A well-planned and executed experiment may provide a great deal of information about the effect on a response variable due to one or more factors. Many experiments involve holding certain factors constant and altering the levels of another variable. However, this “one factor at a time” (OFAT) approach to process knowledge is inefficient compared to changing multiple factor levels simultaneously.
As was mentioned previously, there are multiple approaches to DOE. OFAT, Full and Fractional factorial, Taguchi and Response surface methodology (RSM). However, the RSM proves to be the best approach among the existing methods for DOE.
What is Response Surface Methodology (RSM)?
Response Surface methodology, or RSM for short, is a set of mathematical methods determining the relationship between one or more response variables and several independent (studied) variables. This method was introduced by Box and Wilson in 1951 and is still used today as an experimental design tool. RSM is a set of statistical techniques and applied mathematics for building experimental models. The goal in RSM is to optimize the response (output variable) affected by several independent variables (input variables). An experiment is a series of tests called executions. In each experiment, changes are made to the input variables to determine the causes of the response variable’s changes. In response level designs, constructing response procedure models is an iterative process.
As soon as an approximate model is obtained, it is tested by the good-fit method to see if the answer is satisfactory. If the answer is not confirmed, the estimation process starts again, and more experiments are performed. In designing experiments, the goal is to identify and analyze the variables affecting the outputs with the least number of experiments. This method achieves the best response surface by discovering each design variable’s optimal response level. In designing experiments, the goal is to identify and analyze the variables affecting the outputs with the least number of experiments.
What is Optimization in ANSYS Fluent?
Optimization is the process of acquiring the best answer for a selected parameter. Using ANSYS, one can perform two types of Optimization. 1-Direct Optimization, 2-Indirect Optimization. Both of these methods will result in the same answer but with different steps. Direct Optimization predicts the behavior of a system without any intermediary step. In contrast, indirect Optimization needs the data obtained by the RSM to provide the user with the correct mathematical function for predicting the system behavior.
What do I learn from this tutorial?
Step 1
In the first part of this tutorial that experienced Engineers in the MR-CFD company prepared, you will first learn about different DOE methods, including RSM and its history. Next, the advantages or disadvantages of these methods over one another will be explained along with their theoretical aspects. Therefore, you can be sure you will learn the theoretical bases you need in the introductory section even if you don’t have any experience in the field of DOE or Optimization whatsoever.
Step 2
In the second part, the RSM optimization process is conducted using ANSYS software. This project will show you how to apply this method to optimize different combustion chamber parameters step by step. For instance, we will start from scratch by designing the geometry of the combustion chamber and show you how you can parametrize your design. In the next step, you will see how the meshing is performed over the designed geometry. Next, we will explain how to set up the Fluent software and define other needed parameters. After that, we will show you how to perform a parameter correlation process to find out which input parameters have a significant effect on our output parameters to reduce the number of input parameters and hence our computational time by omitting the less needed input parameters.
Finally, using the Central Composite Method (CCD), which is a subset to RSM, we generate the design point chart, which includes all the needed experiments to perform the Optimization by defining the investigation span for each parameter. In simple words, indirect Optimization in ANSYS uses the generated data by RSM to extract a mathematical function that can predict the system’s behavior.
Step 3
In the next part, the direct optimization process is explained in detail. In this type of Optimization, in contrast to the previous method (RSM), the design points will be created based on the need of the software and based on a predefined algorithm. As the optimization process advances, the software may decide it needs more sampling points to predict the mathematical function of the system accurately. In other words, opposite to Optimization using RSM, the whole Optimization is performed directly without any intermediary step. Finally, when the process is finished, ANSYS will provide you with 3 candidate points that are the best answers for your system based on the user-defined objective(s) (i.e., the circumstances you want your model to meet)
Project description
In this project, the combustion process inside a combustion chamber is simulated and parameters such as heat generation rate, pollution formation, etc. are monitored. (The list of input and output parameters are shown in the following table.) As was mentioned in the previous paragraphs, the target of this project is to optimize the geometrical parameters of the combustion chamber for targets such as maximizing the value of heat generation rate while minimizing the amount of formed pollution. Two types of optimization are examined in this project; Indirect optimization using the RSM method and direct optimization. In the indirect optimization step, we use the CCD method to generate the design points needed to perform the RSM analysis. Then we will perform a parameter correlation process to identify the most effective input parameters on our model.
Next, we will show you how to optimize the combustion chamber’s input parameters based on the data which was generated for RSM analysis.
Direct Optimization
In the second part, we show the steps to performing direct optimization in which we will first generate the design points needed for the optimization process and then by defining desired target(s) (such as maximizing the value of heat generation rate while minimizing the amount of formed pollution) the software will start the optimization process and will provide you with the best three candidate points.
The RNG k-epsilon model is exploited to solve the turbulent fluid equations. The energy equation is enabled to calculate the temperature change and model the heat transfer. Also, the species transport model along with the volumetric reaction option has been activated to simulate the combustion process inside the cylindrical combustion chamber.
| Input parameters | The span of variations for input parameters | Output parameters |
| Cone angular velocity | 100-400 rad/s | Outlet temperature |
| Outer diameter | 0.099-0.121 m | CO2 mass fraction |
| Cone height | 0.027-0.033 m | CO mass fraction |
| Cone length | 0.27-0.33 m | Average temperature |
| Air inlet diameter | 0.0018-0.0022 m | Total heat generation |
| Fuel inlet diameter | 0.009-0.011 m | Chamber heat flux |
| Air inlet offset | 0.009-0.011 m | |
| Fuel inlet offset | 0.009-0.011 m | (DOE) |
Geometry and Mesh
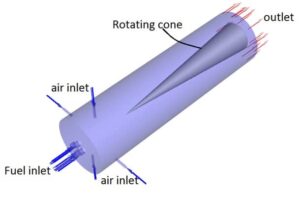
We design the geometry of the present project in ANSYS Design Modeler software. It consists of several parts like 4 Fuel inlets on the bottom face of the combustion chamber, and 4 air inlets offset to produce a swirl flow inside the combustion chamber, and a rotating cone inside the chamber to increase the effect swirl over the combustion efficiency.
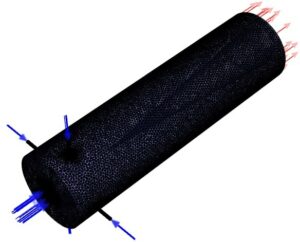
Also, We carry out the meshing of the model in ANSYS Meshing software, and apply a specific body sizing over each generated geometry based on the geometrical input parameters.
CFD simulation settings
- Simulation applies a pressure-based solver.
- The present simulation and its results are steady and do not change as a function time.
- We ignore the effect of gravity.
The following table summarized the applied settings.
| Models | ||
| Viscous model | k-epsilon | |
| k-epsilon model | RNG | |
| near-wall treatment | standard wall function | |
| Species | Species transport | |
| Reaction | Volumetric | |
| Turbulence chemistry interaction | Eddy-dissipation | |
| Energy | On | |
| Boundary conditions | ||
| Inlets | Mass flow inlet | |
| Air | Mass flow rate | 0.00036135 kg/s |
| Temperature | 300 K | |
| Fuel | Mass flow rate | 3 kg/s |
| Temperature | 300 K | |
| Outlet | Pressure outlet | |
| Walls | ||
| Chamber wall & wall-solid | Wall motion | Stationary wall |
| Thermal | Convection | |
| h = 25 W/m2K | ||
| Free stream temp = 300K | ||
| Cone | Wall motion | Rotating wall |
| Rotating velocity | CA (input parameter) | |
| Thermal | Heat flux = 0 W/m2 | |
| Solution Methods | ||
| Pressure-velocity coupling | Coupled | |
| Spatial discretization | pressure | second-order |
| momentum | second-order upwind | |
| Mass fraction of species | second-order upwind | |
| turbulent kinetic energy | second-order upwind | |
| turbulent dissipation rate | second-order upwind | |
| Energy | second-order upwind | |
Result and discussion
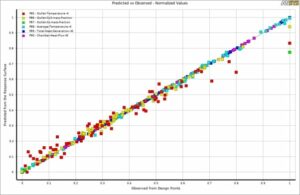
As can be seen in the goodness of fit graph, there is a good agreement between the predicted values (predicted function) and the points which have been simulated. Therefore, the obtained data can be trusted to give you the optimal values for each outlet parameter based on the inputs. You can extract many different 3D surfaces to view the results better and understand the mutual effects of each input parameter over the output.
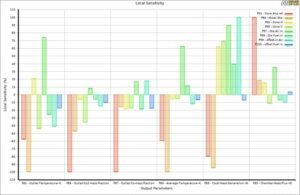
By viewing the local sensitivity chart, you can understand which input parameter significantly affects outputs. For instance, in this project, you can easily say that the combustion chamber’s cone angular velocity and outer diameter play a distinct role almost over all the output parameters.
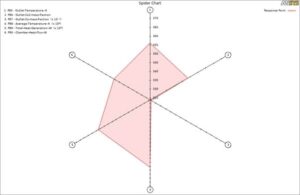
Finally, in the spider chart, you can observe the responses for each parameter. (i.e., when we have the highest value for parameters 1,2,4,5 and 6, parameter 3 will have its least value, which is entirely logical since when we have a complete stoichiometric reaction, the generated heat will reach its highest value while the mass fraction of CO will reach zero.)
There are a geometry file, Mesh file and a comprehensive Training Movie that presents how to solve the problem and extract all desired results.
برای ثبت نقد و بررسی وارد حساب کاربری خود شوید.



دیدگاهها
هیچ دیدگاهی برای این محصول نوشته نشده است.